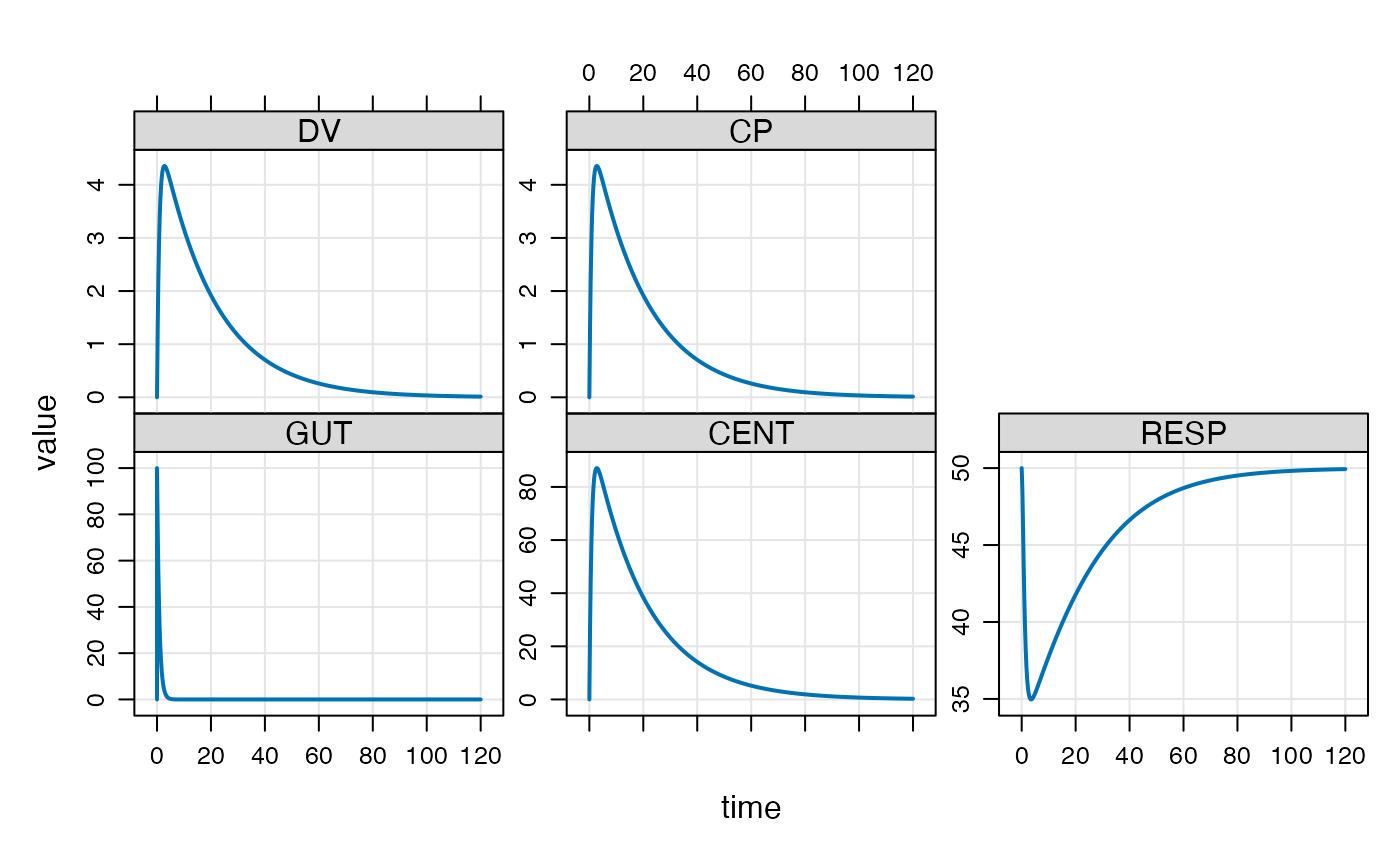
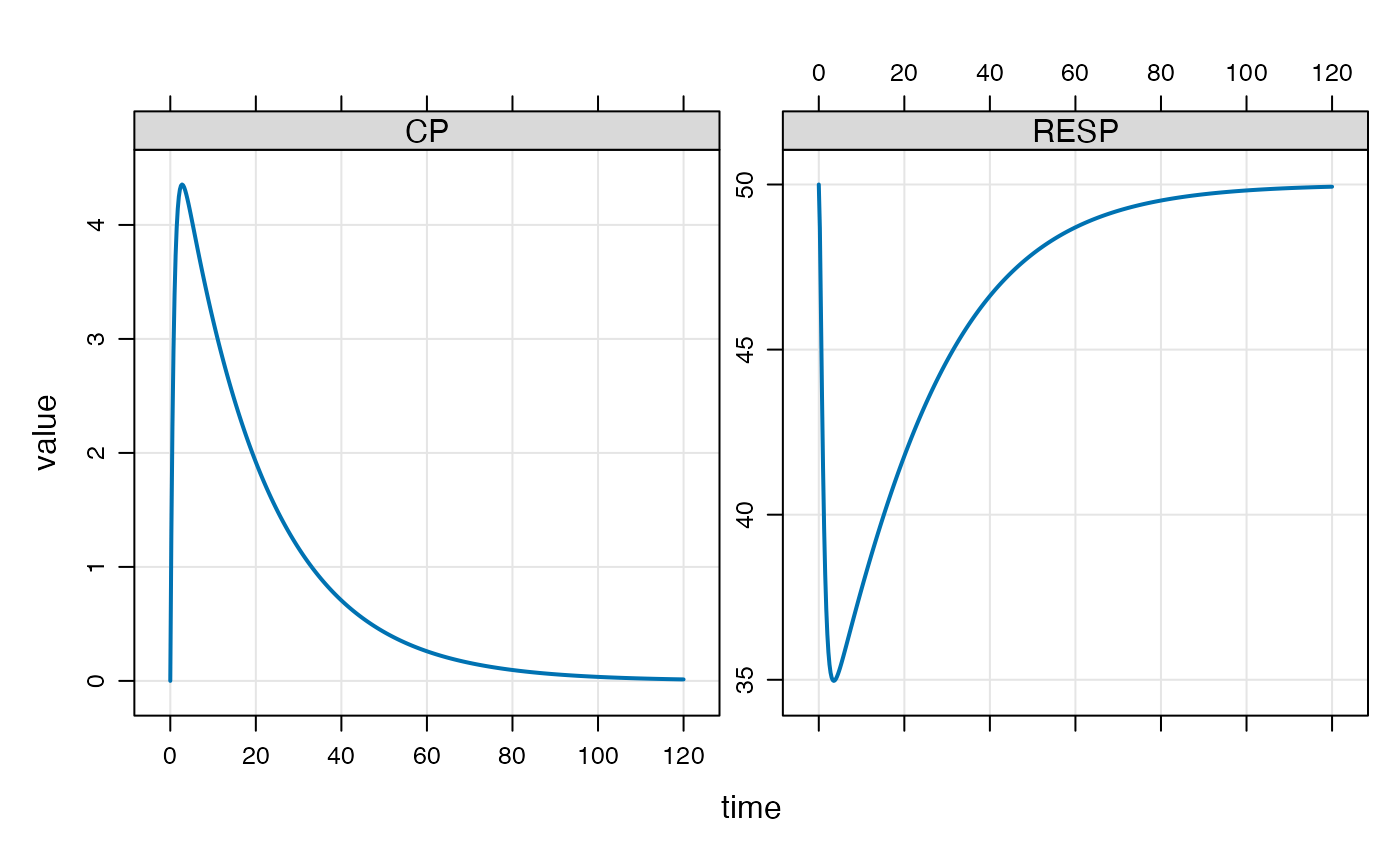
Plot data as an mrgsims object
Usage
plot_sims(.data, ..., .f = NULL, .dots = list())Arguments
- .data
a data frame
- ...
unquoted column names to plot on y-axis
- .f
a formula to plot
- .dots
extra arguments passed to
lattice::xyplot
Plot data as an mrgsims object
plot_sims(.data, ..., .f = NULL, .dots = list())a data frame
unquoted column names to plot on y-axis
a formula to plot
extra arguments passed to lattice::xyplot