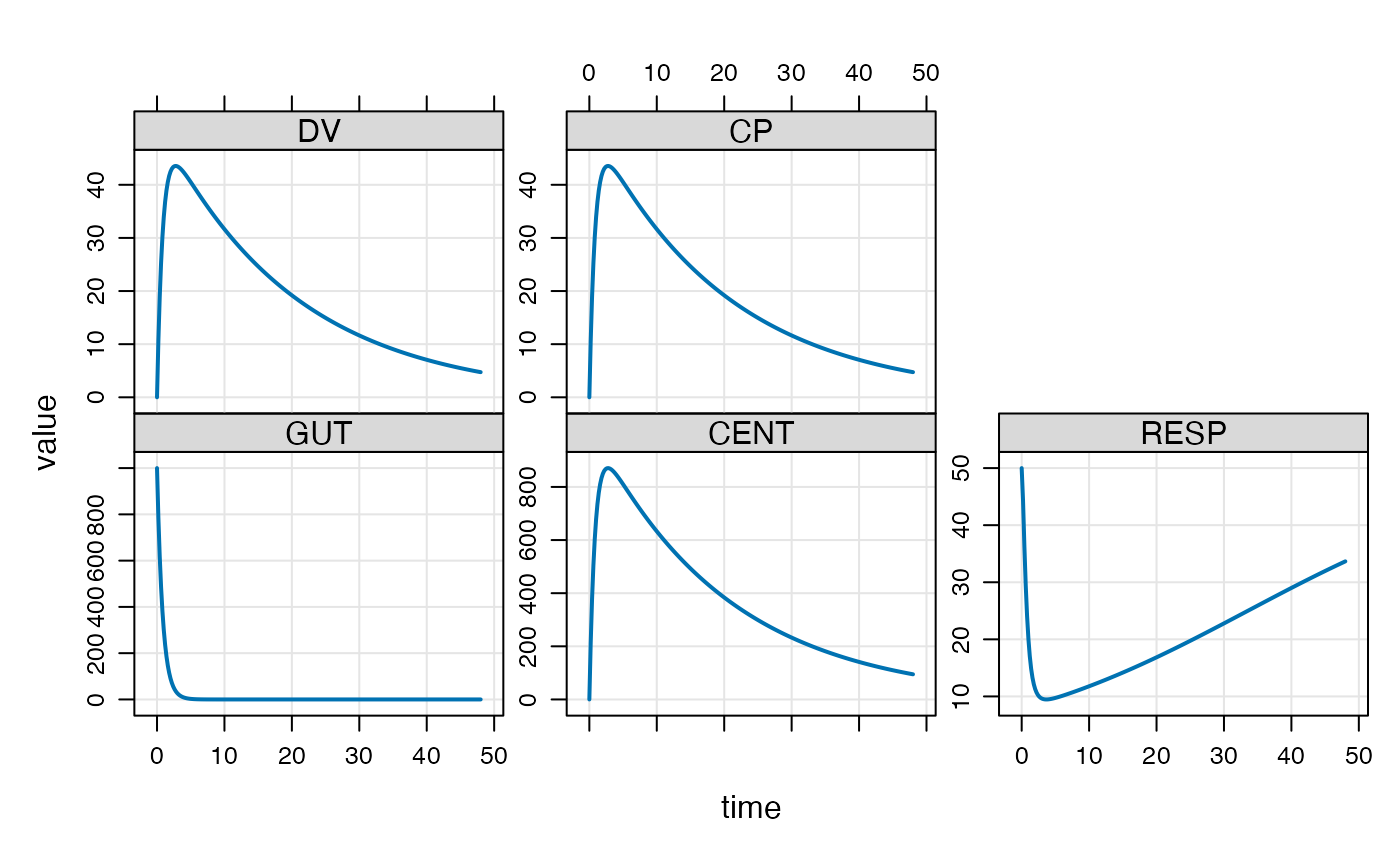
Generate a quick plot of simulated data
Usage
# S4 method for class 'mrgsims,missing'
plot(x, limit = 16, ...)
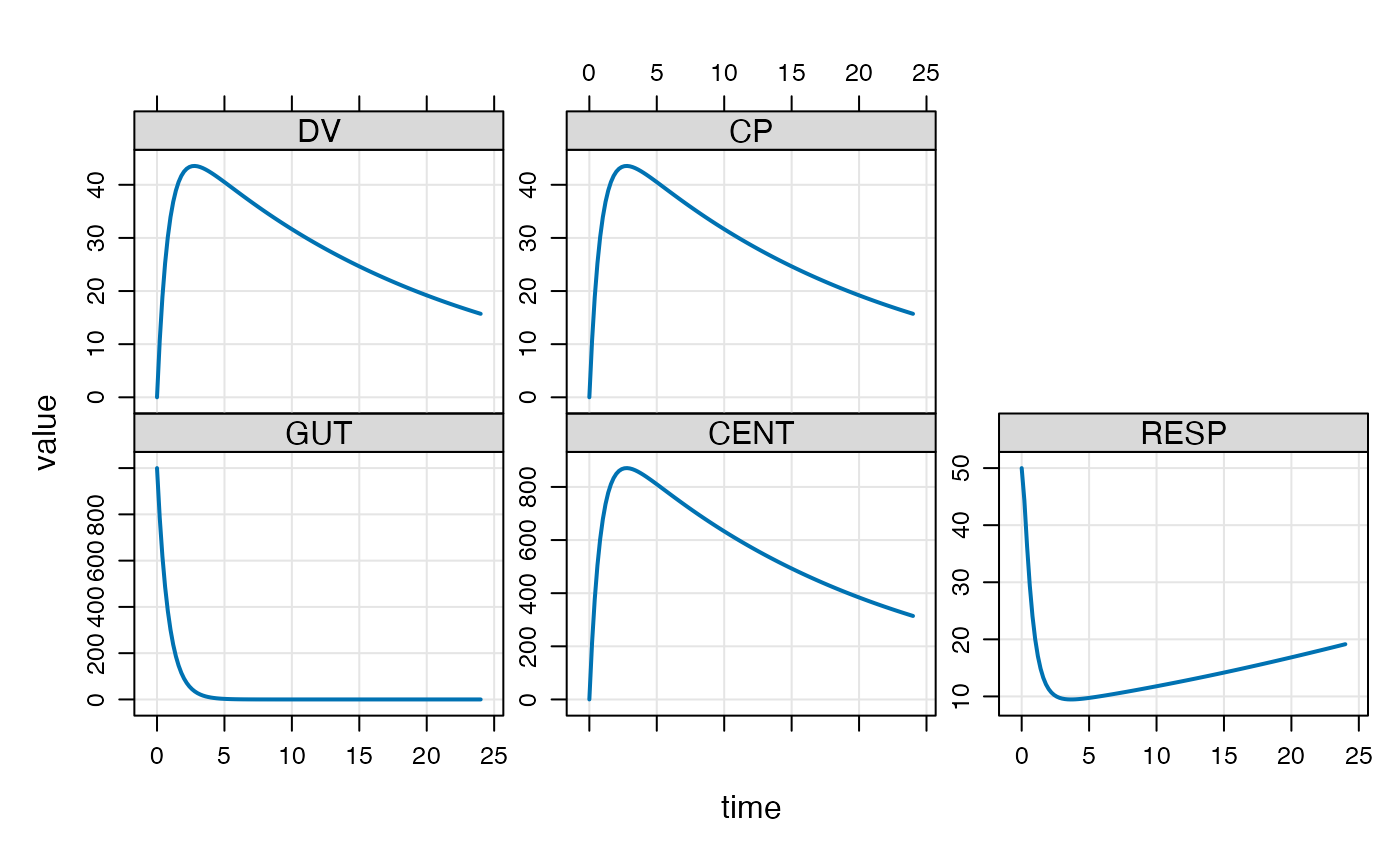
# S4 method for class 'mrgsims,formula'
plot(
x,
y,
limit = 16,
show.grid = TRUE,
outer = TRUE,
type = "l",
lwd = 2,
ylab = "value",
groups = ID,
scales = list(y = list(relation = "free")),
fixy = NULL,
logy = NULL,
logbr = 0,
equispaced.log = FALSE,
...
)
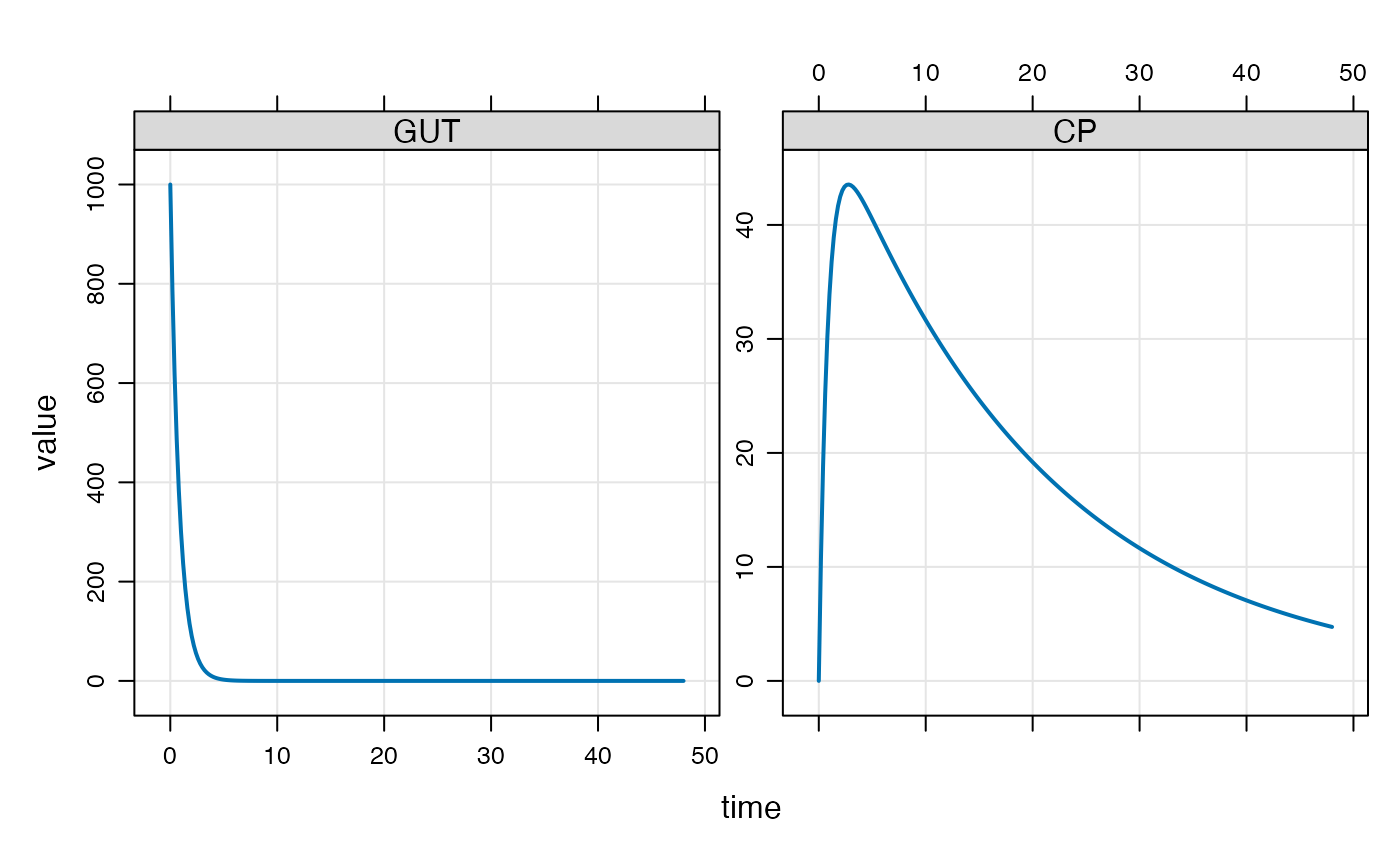
# S4 method for class 'mrgsims,character'
plot(x, y, ...)Arguments
- x
mrgsims object.
- limit
limit the the number of panels to create.
- ...
other arguments passed to
lattice::xyplot().- y
formula used for plotting.
- show.grid
logical indicating whether or not to draw
panel.grid.- outer
passed to
lattice::xyplot().- type
passed to
lattice::xyplot().- lwd
passed to
lattice::xyplot().- ylab
passed to
lattice::xyplot().- groups
passed to
lattice::xyplot().- scales
passed to
lattice::xyplot().- fixy
make the y-axis scale the same for all variables; ignored if
scalesis not a list.- logy
plot the y variables on log scale; ignored if
scalesis not a list.- logbr
log scale breaks indicator; use
1for breaks every log unit; use3for breaks every half log unit; use0for default breaks; ignored ifscalesis not a list.- equispaced.log
see
scalesargument inlattice::xyplot(); ignored ifscalesis not a list.